Choosing the Right Traffic Analysis Tools for Your Website
When I first started managing websites for clients, I made the mistake of relying on a single dashboard to understand visitor behavior. I assumed that if the number of sessions looked healthy, everything was fine. It took a slow quarter and a frustrated client to teach me that traffic quality matters far more than volume. That lesson pushed me to explore a range of traffic analysis tools, and over time I learned that no single platform tells the whole story.
Every website is different. An ecommerce store needs to track checkout drop-offs. A content publisher cares about time on page and scroll depth. A B2B service provider wants to know which marketing channels bring leads that actually convert. The right mix of traffic analysis tools depends on your specific goals, your team's technical comfort, and your budget. Let me walk through what I've found to be the most effective options and how to choose among them.
Understanding the Core of Web Analytics
At the foundation of any analytics setup is a robust web analytics platform. Google Analytics is the obvious starting point for most people, and for good reason. It is free, deeply integrated with Google's advertising ecosystem, and offers an enormous range of reports. But free comes with trade-offs. Google Analytics processes data through sampling on larger sites, which can skew your numbers. It also requires careful configuration to avoid tracking your own visits or mixing up internal traffic with real users.
If you want more control over your data privacy, Matomo (formerly Piwik) is a strong alternative. Matomo Analytics gives you full ownership of your data because you host it on your own server. I have used Matomo for a client who needed to comply with strict European data regulations, and it handled the requirements cleanly without the workarounds that Google Analytics demands. Piwik PRO offers a similar philosophy with enterprise features like consent management and advanced filtering.
Another option that often gets overlooked is Open Web Analytics. It is open-source, lightweight, and surprisingly capable for a small site. It does not have the polish of Google Analytics, but it gives you raw data without any third-party dependency. For hobby sites or early-stage projects, that simplicity can be a blessing.
Beyond Pageviews: Understanding User Behavior
Standard analytics platforms tell you what happened, how many people visited, which pages they viewed, where they came from. But they rarely explain why a visitor left without converting. That is where behavioral analytics tools come in.
Hotjar is my go-to recommendation for clients who want to see actual user sessions. Their heatmaps show where people click, where they hover, and where they stop scrolling. Their session recordings let you watch a real person navigate your site, which often reveals confusing layouts or broken flows that no dashboard would catch. I once watched a recording where a visitor tried to click on a static image, thinking it was a button. That single observation led to a redesign that lifted conversions by 12 percent.
Crazy Egg offers similar heatmaps and scroll maps but also includes A/B testing features. If you are running experiments on landing pages, having the heatmap data alongside the test results helps you understand why a variant performed better, not just that it did. Clicky takes a different approach by focusing on real-time analytics and a clean interface that feels faster than most competitors. It is particularly useful for agencies that need to monitor multiple client sites at once.
For mobile apps or product-led websites, Heap and Amplitude are worth considering. They track every user interaction automatically, so you do not have to pre-define events. That makes them powerful for discovery, you might find that users who watch a demo video are three times more likely to sign up, even if you never planned to track video views. Heap's retroactive data ability means you can go back and analyze past events without having set up tracking in advance. That alone has saved me hours of manual data reconstruction.
Competitive Intelligence and Market Research
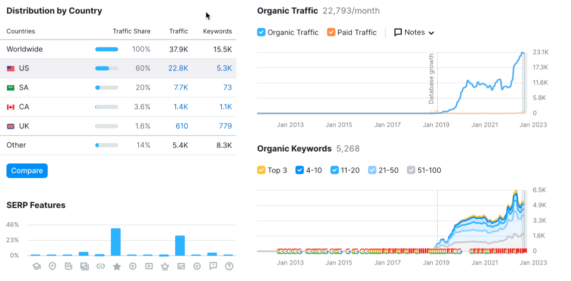
Sometimes the most valuable insights come from looking outside your own site. Similarweb gives you estimated traffic numbers for any website, along with audience demographics, top referring channels, and keyword overlap. I use it early in the strategy phase for a new client to benchmark their performance against competitors. It is not perfectly accurate, the data is estimated, but it is consistent enough to spot trends.
Ahrefs and Semrush are primarily SEO tools, but they include powerful traffic analysis features. Ahrefs shows you the organic keywords that drive traffic to any domain, plus the pages that rank for those terms. Semrush adds a layer of paid search analysis and display advertising data. Moz offers similar capabilities with a focus on domain authority and link analysis. For a complete picture of your traffic sources, pairing one of these tools with your analytics platform is almost essential.
Chartbeat is built for publishers who need to track content engagement in real time. It shows which articles are gaining traction, how far readers scroll, and which social platforms drive the most engaged traffic. If you run a news site or a blog that depends on ad revenue, Chartbeat helps you optimize your content lineup by the minute.

Technical Setup and Data Collection
All these tools rely on you collecting data correctly in the first place. Google Tag Manager is the best way to manage tracking codes without editing your site's source code every time. I use it to deploy Google Analytics, Hotjar, and conversion tracking scripts simultaneously. It also lets you set up event triggers for actions like form submissions or button clicks without writing JavaScript.
Google Search Console is another free tool that should be part of every analytics stack. It shows you the queries that actually bring users from Google search, plus your click-through rates for each query. That data helps you decide which pages to optimize for better rankings and which queries might need new content entirely.
For international audiences, Yandex Metrica is the dominant analytics platform in Russia and parts of Eastern Europe. If your site targets those regions, you cannot ignore it. Its interface is different from Google Analytics, but the core metrics are similar. Setting it up alongside your main analytics tool gives you a more complete view of global traffic patterns.
Making the Choice: Practical Guidance
When I consult with clients on selecting traffic analysis tools, I start with three questions:
- What is your primary goal? (Ecommerce, lead generation, content monetization?)
- How much technical skill does your team have for setup and maintenance?
- What is your budget for both tools and the time to interpret the data?
For a small business just starting out, I recommend Google Analytics plus one behavioral tool like Hotjar or Crazy Egg. That combination covers the basics of volume, source, and user behavior without overwhelming you with data. As the site grows, add an SEO tool like Ahrefs or Semrush to understand your organic traffic drivers better. For larger organizations, Matomo Analytics or Piwik PRO can replace Google Analytics if data privacy is a concern.
Enterprise teams with complex funnels should consider Adobe Analytics. It is expensive and has a steep learning curve, but its segmentation and attribution modeling are more sophisticated than anything else in this list. Similarly, Kissmetrics focuses on individual user tracking over time, which is ideal for subscription-based businesses that need to understand retention and churn.
Pitfalls to Avoid
One common mistake is using too many tools at once. I have seen teams install six different platforms and then ignore all of them because the data was contradictory or overwhelming. Start with two or three that directly answer your most pressing questions. Add more only when you have a clear reason.
Another trap is ignoring data quality. If your Google Analytics is not filtered for internal traffic, your numbers will be inflated. If your Tag Manager setup has duplicate tags, events will fire twice. Spend the time to validate your tracking before you trust the reports. A good rule of thumb is to run a test session using a tool like Google's Tag Assistant or the browser extension for your analytics platform to confirm that every event fires correctly.
Finally, do not treat any single metric as gospel. A high bounce rate might mean your content is irrelevant, but it could also mean visitors found exactly what they needed on the first page and left satisfied. Context matters. That is why combining quantitative data from traffic analysis tools with qualitative data from session recordings or user surveys gives you the full picture.
I have been through the cycle of tool overload and tool neglect. The sweet spot is a small, well-integrated set of tools that you actually check weekly and use to make decisions. Start with the fundamentals, add based on real needs, and always keep the question "What will I do differently with this data?" at the center of every tool choice.